Exploratory Data Analysis of US Census Demographic Data
2021
- Objective: Explore and derive insights from US Census Demographic Data.
- Visualization Techniques:
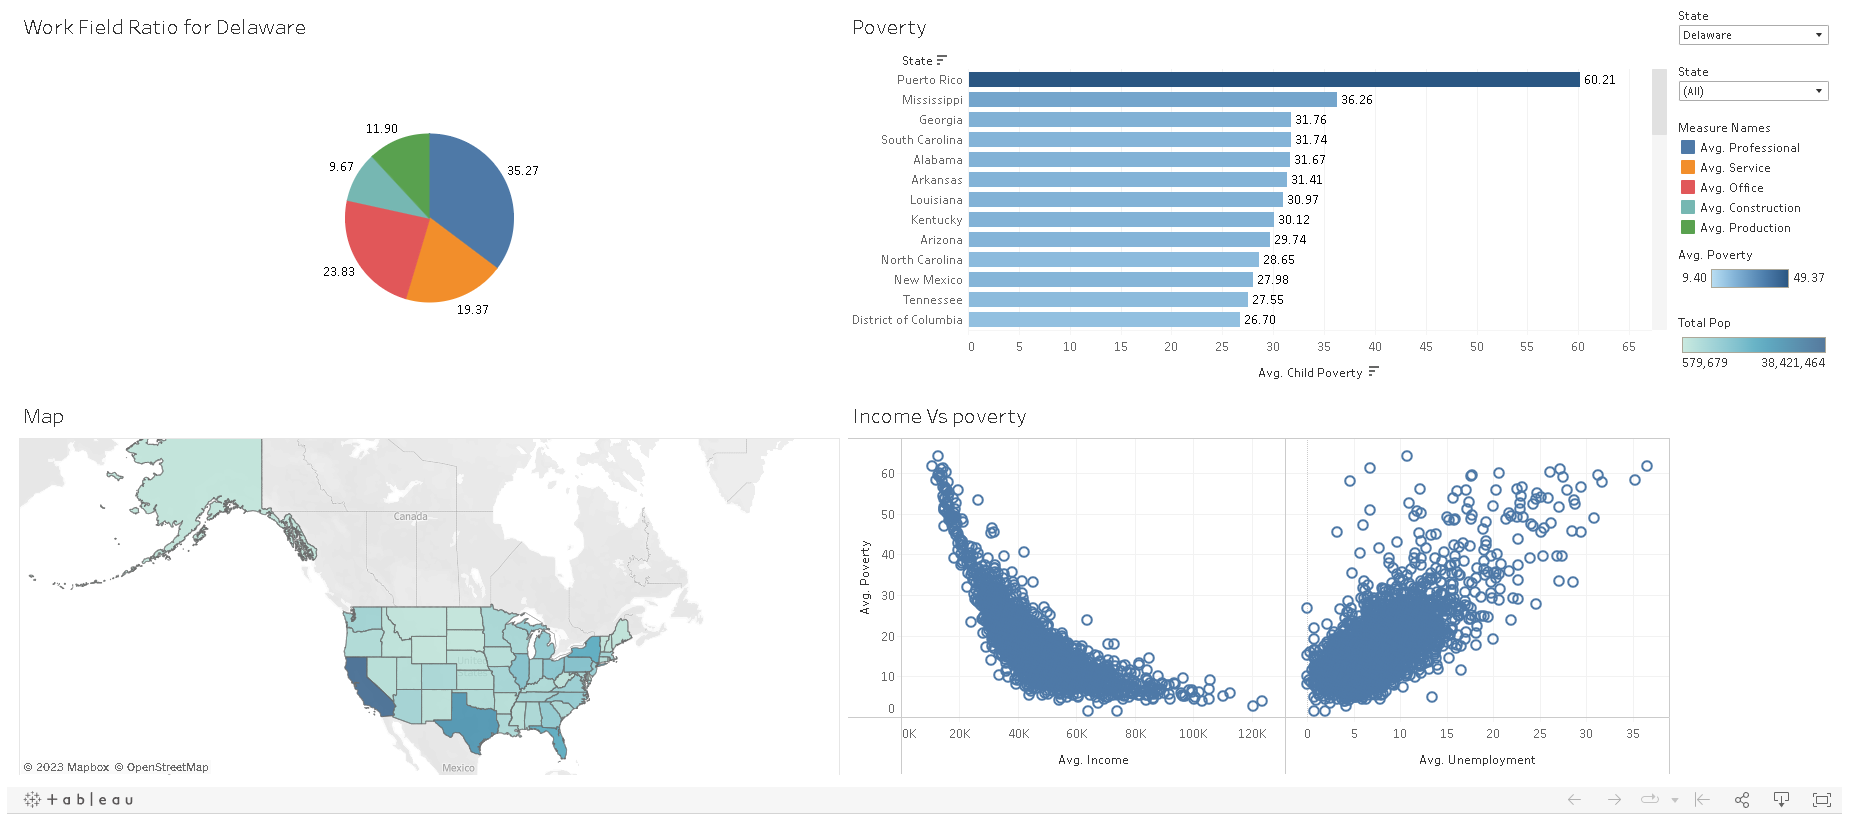
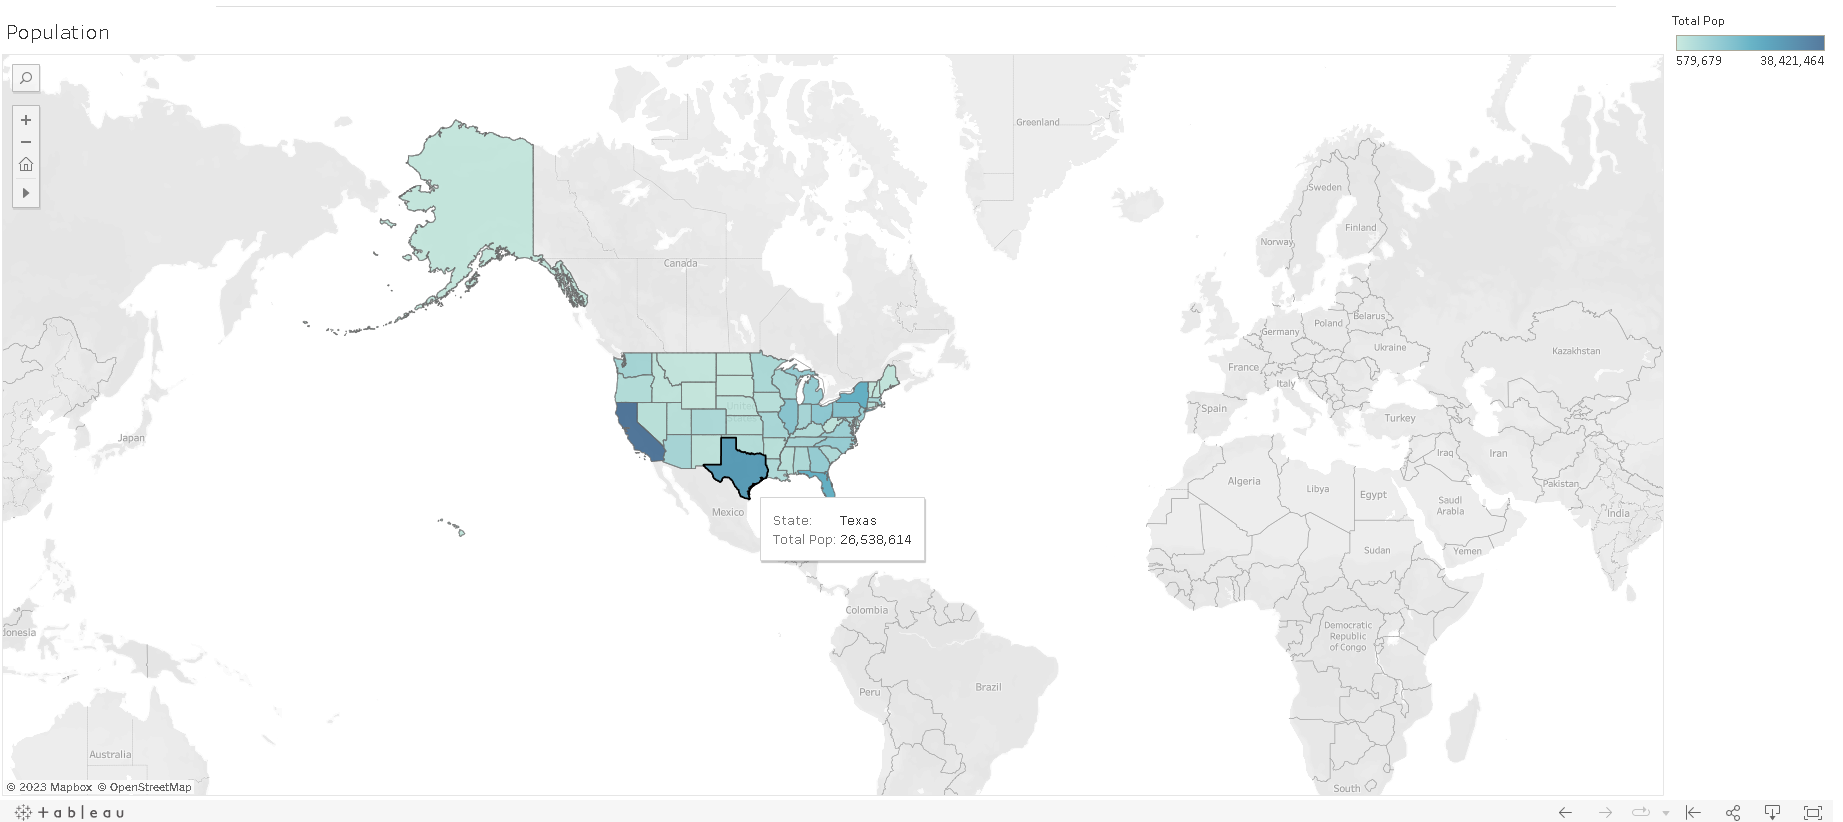
- Map Chart: Represents population distribution across states with a color scale for a comprehensive overview.
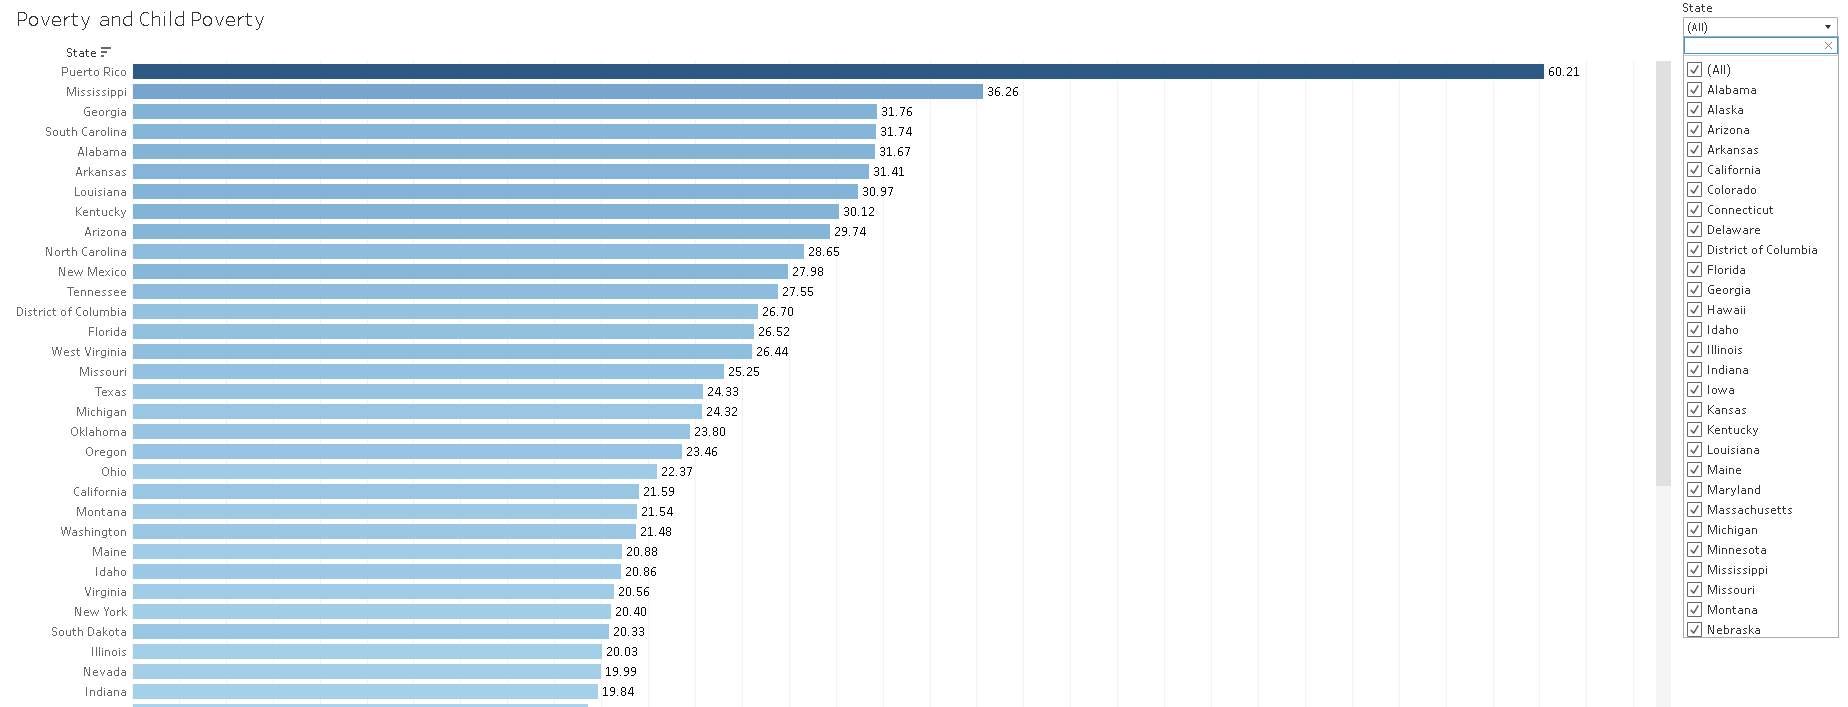
- Bar Charts: Depict poverty and child poverty, showcasing correlations between these factors across states.
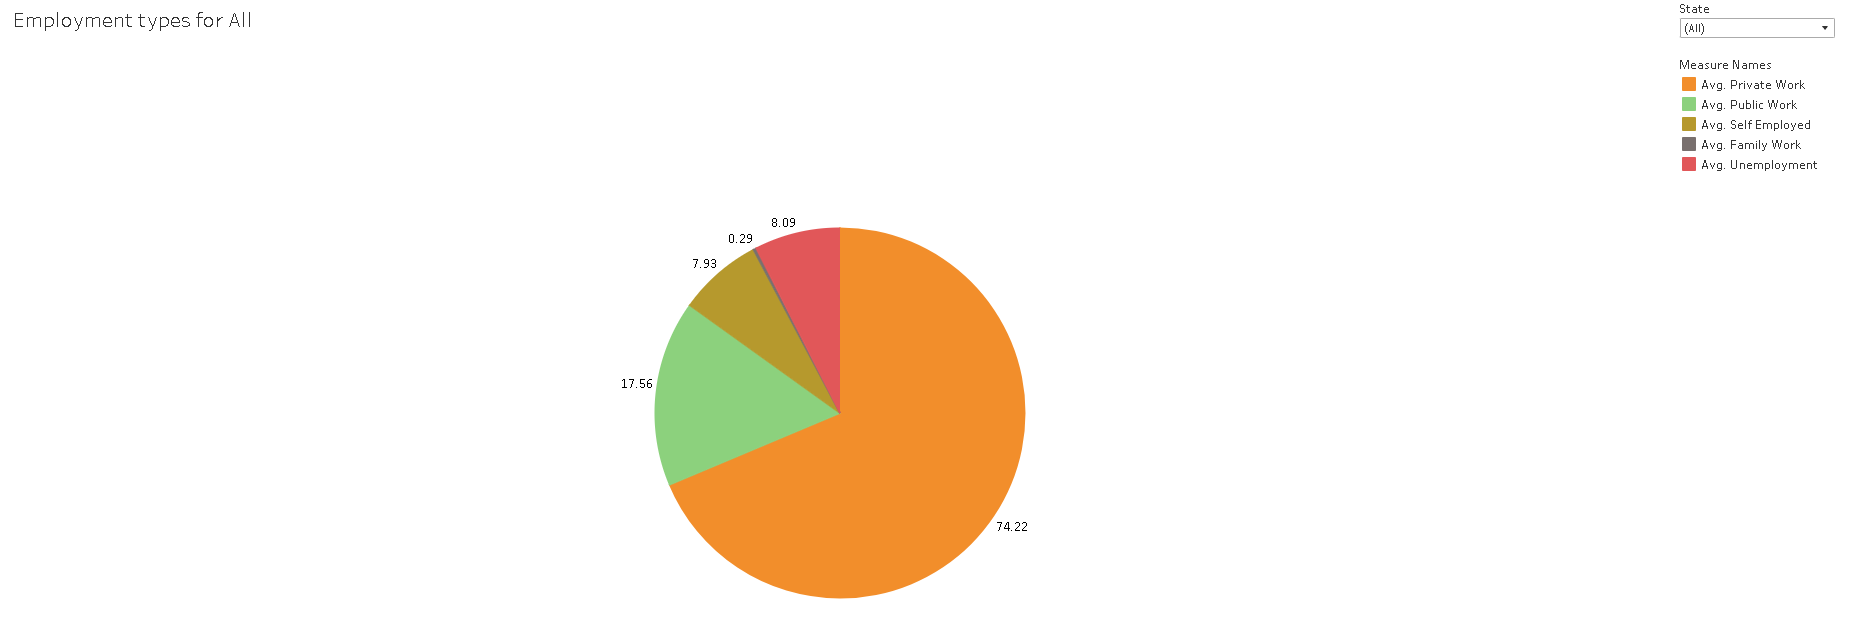
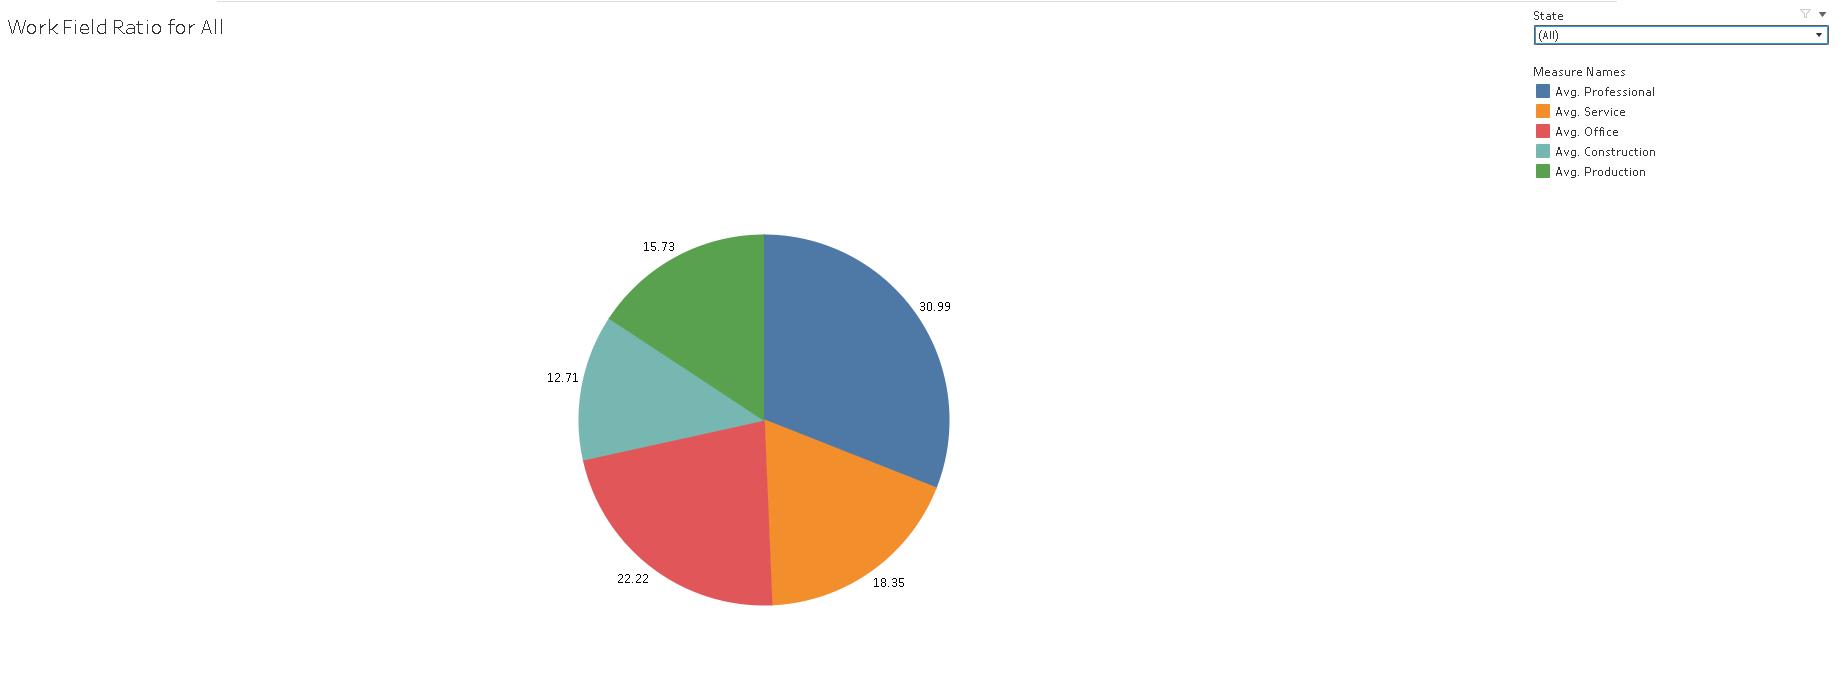
- Pie Charts: Illustrate work fields and employment types, providing percentage breakdowns within each category.
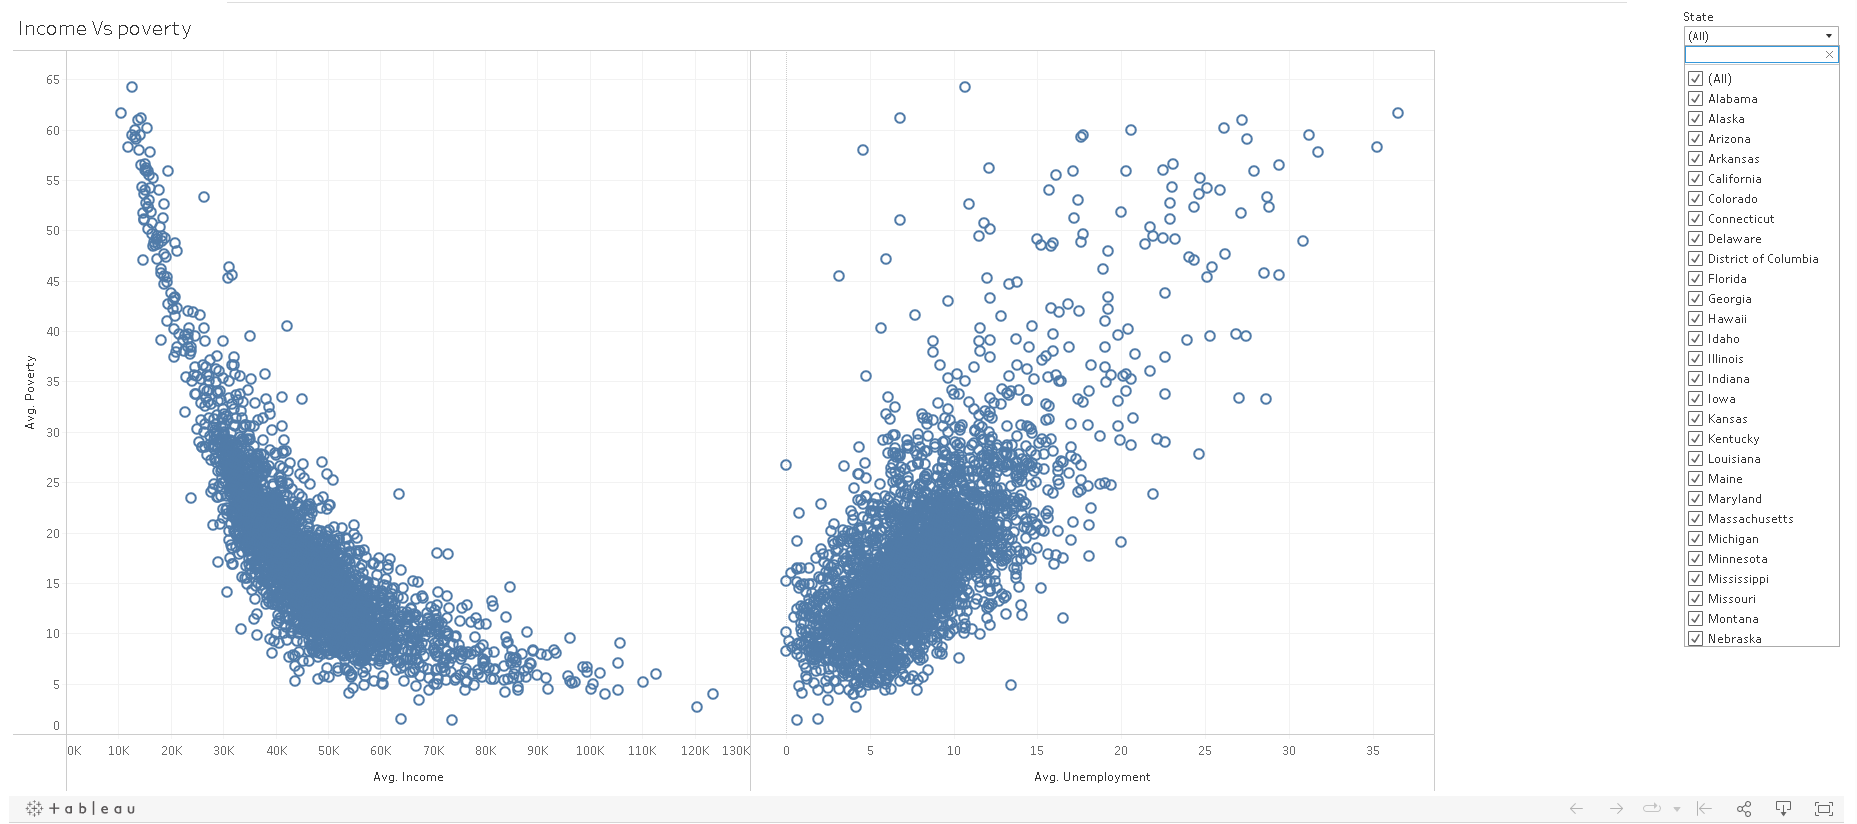
- Scatter Plot: Examines relationships between poverty and income, and poverty and unemployment, revealing correlations between numerical factors.